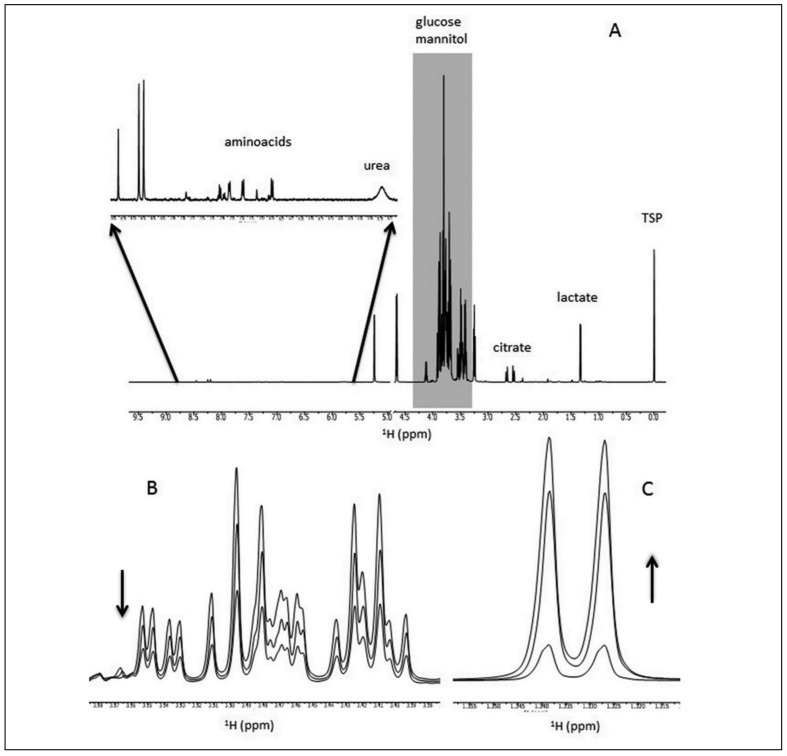
Figure 2.
1H-NMR spectra of a sample of RBC supernatant.
(A) Whole spectrum at 2 days of storage: the inset shows a magnification (100 x) of the region 5.7–8.5 ppm; (B) decrease of glucose concentration (3.3–3.6 ppm) and (C) increase of lactate (1.30–1.36 ppm) peaks at different storage times (2, 23 and 42 days).

