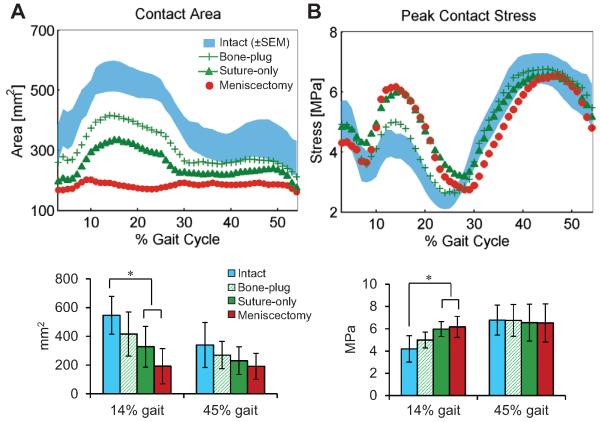
Figure 5.
(A) Reduction in the contact area and (B) increase in peak contact stress across the medial tibial plateau throughout the stance phase of gait. The plots on the top show the mean curves for each condition; the shaded area of the intact condition indicates the standard error (shaded areas on the other curves were removed for better readability). The plots on the bottom show the values (mean ± standard deviation) of each condition at 14% and 45% of gait. *Statistically significant difference (P < .05).

