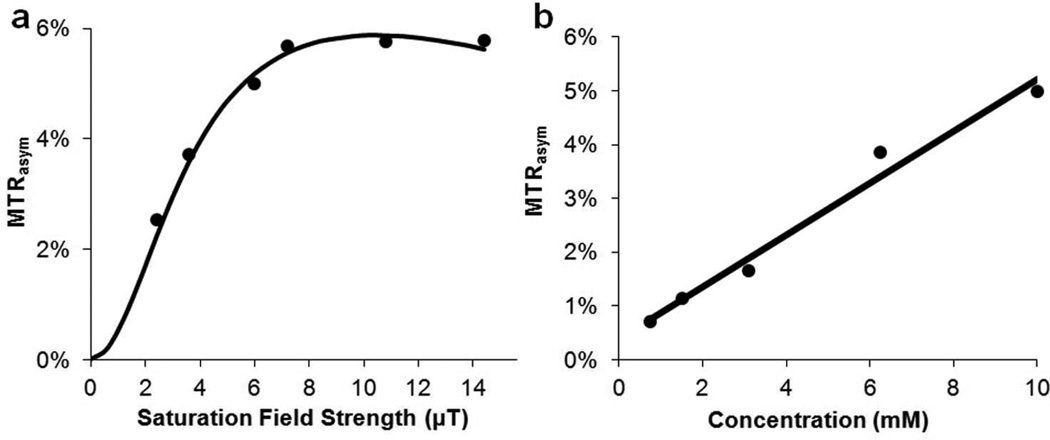
Figure 2.
CEST properties of 5. a) QUESP data at 10 mM at pH = 7.4, with ksw = 1.0 kHz where the data are shown as points and the solid line representing the best fit after numerically solving the 2-pool Bloch equations; b) CEST contrast at 4.8 ppm as a function of concentration using B1 = 3.6 µT. (Solid line: linear fitting)

