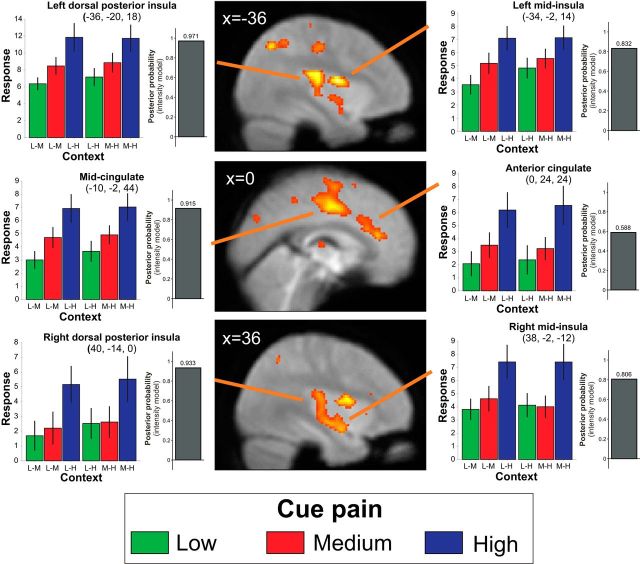
Figure 2.
Responses to painful cue within pain-responsive regions are context-independent. SPM showing the main effect of pain (i.e., BOLD signal differences between the three pain levels) overlaid on the group average-normalized EPI. Threshold for display p < 0.001 uncorrected. Colored bar charts represent across-subject mean activity levels for all conditions (±SEM) for selected peak voxels (context refers to pain levels experienced within the current block: L, Low; M, medium; H, high). Bar heights are only readily interpretable relative to other conditions within the same region (see Materials and Methods). Gray bar chart represents Bayesian model selection result demonstrating that activity profiles in these regions are more consistent with intensity than rank responsiveness.

