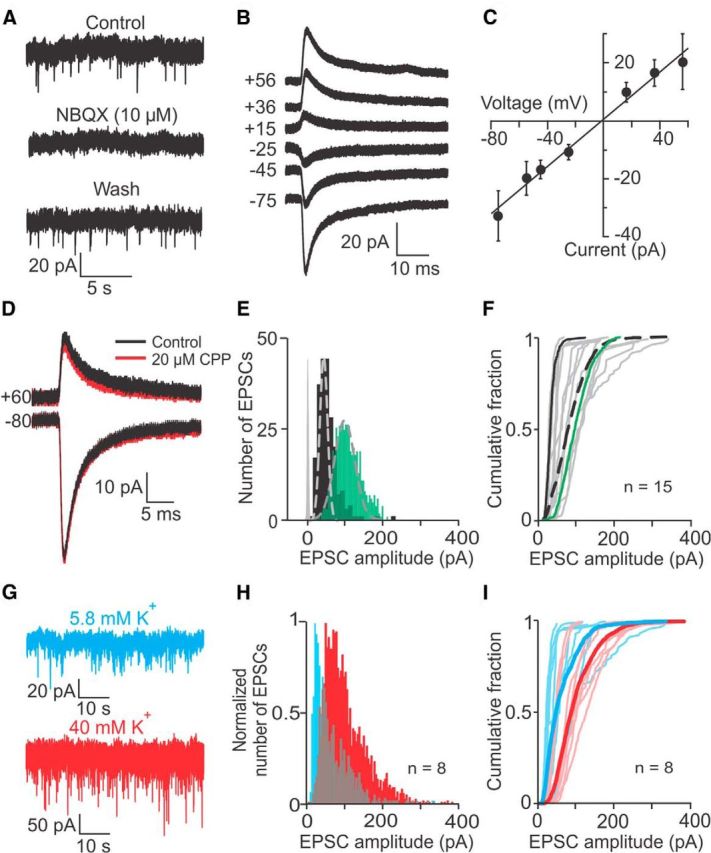
Figure 2.

EPSC amplitude distributions recorded from vestibular calyces. A, EPSCs are mediated by AMPA receptors, as shown by complete and reversible block by the AMPA receptor blocker NBQX (10 μm). External solution with 5.8 mm K+; holding potential of −103 mV. B, Calyx recording with average EPSCs at different holding potentials (indicated on the trace in mV). C, Current voltage relation of average EPSCs (4 recordings) is close to linear and reverses at ∼0 mV. D, The NMDA receptor blocker CPP (20 μm) had no effect on the EPSC waveform at positive or negative holding potentials (indicated on traces). E, Two example EPSC amplitude distributions were close to Gaussian (dashed lines), with small tails toward larger values. Baseline noise distribution in gray. F, Cumulative fraction plots of EPSC amplitudes for 15 calyces (gray) and their average (dashed black). Black and green lines correspond to calyces shown in E. G, EPSC amplitudes and rate increased during application of 40 mm K+ external solution. H, Normalized cumulative fraction plots of EPSC amplitudes pooled from 8 calyces in 5.8 mm K+ (blue) and in 40 mm K+ external solution (red). I, Cumulative fraction plots of EPSC amplitudes for eight calyces in 5.8 mm K+ (individual recordings: light blue; average distribution: blue) shifted to the right in 40 mm K+ external solution (individual recordings: light red; average distribution: red).
