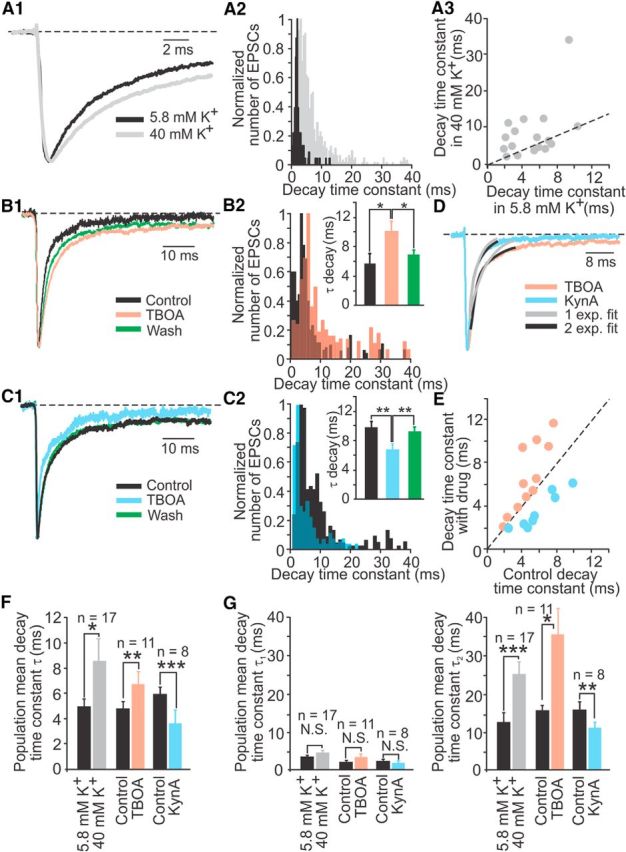
Figure 4.

Glutamate accumulation and spillover contribute to slowing of EPSCs in calyx afferents. A, During application of 40 mm K+, the normalized average EPSC from an example calyx recording showed slower kinetics (A1) with an increase in τdecay (A2). Nine of 17 calyces showed an increase in τdecay (A3). The dashed line represents the unity line. B, In 200 μm TBOA, the normalized average EPSC from an example calyx recording slowed down reversibly (B1) and the distribution of τdecays (B2) showed an increase in larger τdecays, resulting in a significant increase in the mean τdecay (B2, inset). C, In 250 μm KynA, the normalized average EPSC from an example calyx recording became reversibly faster (C1) and the distribution of τdecays (C2) showed an increase in smaller τdecays, resulting in a decrease in the mean τdecay (C2, inset). D, An example recording showing a faster one exponential decay for the average EPSC during KynA application compared with a two exponential decay during TBOA application. E, Changes in τdecay during TBOA or KynA application. F, Single exponential fits and (G) double-exponential fits of τdecays for the population of recorded calyces show significant changes for all conditions applied. n, Number of recordings per condition; *p < 0.05, **p < 0.01, ***p = 0.0001.
