Figure 3.
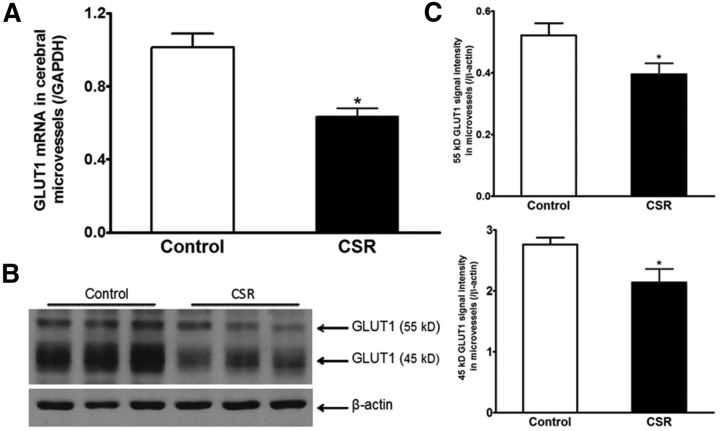
Effect of CSR on GLUT1 expression in enriched cerebral microvessels. A, The mRNA for GLUT1 was decreased by CSR (n = 7) in comparison with the control (n = 6). B, Enriched microvessels had a high level of 45 kDa GLUT1 isoform and less abundant 55 kDa GLUT1 isoform. CSR reduced the level of expression of both after 6 d. C, The significant reduction of both GLUT1 isoforms in WB is shown by densitometric analysis (n = 5 for control and n = 6 for CSR); *p < 0.05.

