
Figure 4.
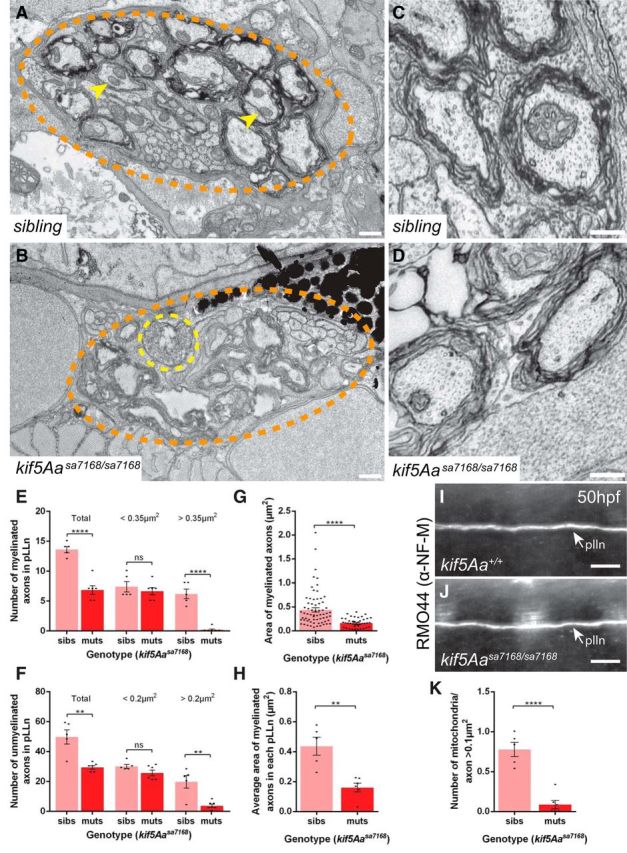
Reduced axon caliber and mitochondria but normal NF-M distribution in kif5Aasa7168 mutant pLLns. A, B, TEM images of cross-sections of the pLLn at somite level 7–8 at 7 dpf. Myelinated axons are evident beneath the basement membrane of (A) WT and (B) kif5Aa mutant axons, which appear smaller, lack mitochondria, and show signs of degeneration. pLLn (orange dotted circle), a degenerating axon (yellow dotted circle), and axonal mitochondria (yellow arrowheads). Scale bar, 0.5 μm. C, D, Higher-magnification TEM images of cross-sections of the pLLn showing intact microtubule and neurofilament networks in (C) WT and (D) kif5Aa mutant axons. E, F, Quantification of total, small diameter, and large diameter (E) unmyelinated and (F) myelinated axons in the pLLn. G, H, Quantification of the (G) area of all myelinated axons in the pLLns and (H) average area of myelinated axons in each pLLn. I, J, Lateral view of pLLn at 50 hpf labeled with α-NF-M antibody RMO44 in (I) WT and (J) kif5Aasa7168 mutants reveals similar NF-M distribution. K, Quantification of mitochondria/axon >0.1 μm2 in the pLLn. For all quantification, nsibs = 3 larvae, 5 nerves; nmuts = 3 larvae, 6 nerves. Error bars indicate ±SEM; **p < 0.01, ****p < 0.0001 (Student's t test).