
Figure 2.
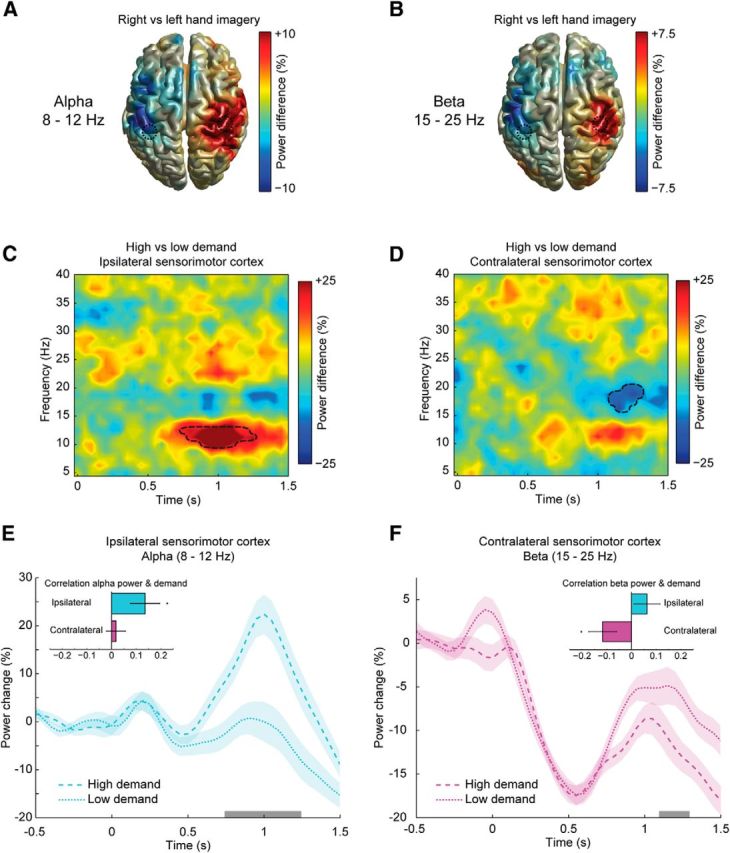
A, B, Source-reconstructed distribution of differential power changes between 600 and 1000 ms after stimulus presentation between motor imagery trials involving the right or left hand are shown for the alpha- and beta-band frequency, respectively. C, D, Dashed circles indicate the location of the voxels that were selected for subsequent analyses. The TFRs show the differential power changes measured during motor imagery with high and low movement selection demands. At the sensorimotor cortex ipsilateral to the hand that was used for imagery, there was a relative increase in alpha-band power in motor imagery trials with high selection demands compared with motor imagery trials with low selection demands (C). The sensorimotor cortex contralateral to the hand that was used for imagery showed a relative decrease in beta-band power (D). Black dashed lines mark the time-frequency boundaries of significant clusters. The line plots illustrate the temporal dynamics of the baseline-corrected power changes during motor imagery trials in the sensorimotor cortex ipsilateral (E) or contralateral (F) to the hand used for imagery. The gray bars along the x-axes indicate the time interval of the clusters shown in C and D. Shaded areas indicate ± 0.5 SE of the difference between conditions. The insets of E and F show the average Pearson correlation coefficients between task demand and alpha- and beta-band power, respectively (error bars represent ± 1 SE, *p < 0.025, one-sided t test).