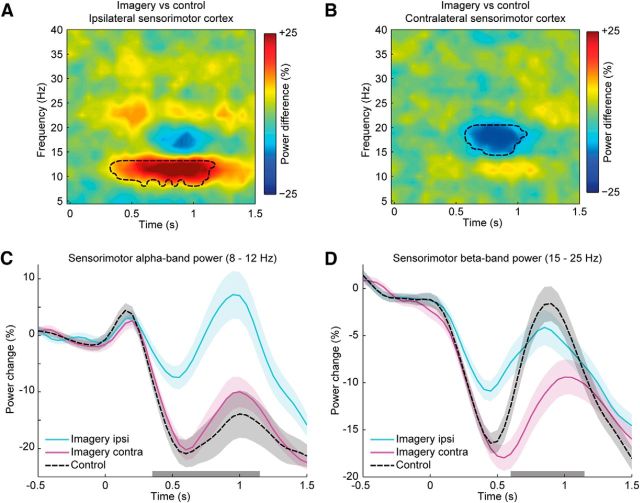
Figure 3.
A, B, Source-reconstructed TFRs of differential power changes between imagery and control tasks are shown for the ipsilateral (A) and contralateral sensorimotor cortices (B). At the sensorimotor cortex ipsilateral to the hand that was used for imagery, there was a relative increase in alpha-band power in the motor imagery condition compared with the control condition (A). The sensorimotor cortex contralateral to the hand that was used for imagery showed a relative decrease in beta-band power (B). Black dashed lines mark the time-frequency boundaries of significant clusters. C, D, The line plots illustrate baseline-corrected power changes of alpha- and beta-band power measured over sensorimotor cortices during imagery and control trials. The line plots distinguish between power changes evoked in the sensorimotor cortex ipsilateral (“imagery ipsi”) and contralateral (“imagery contra”) to the imagined hand. The black dashed lines indicate the spectral power during the control condition (averaged over left and right sensorimotor cortices). The gray bars along the x-axes indicate the time intervals of the clusters shown in A and B. Shaded areas indicate ± 0.5 SE of the differences between imagery and control trials.

