
Figure 1.
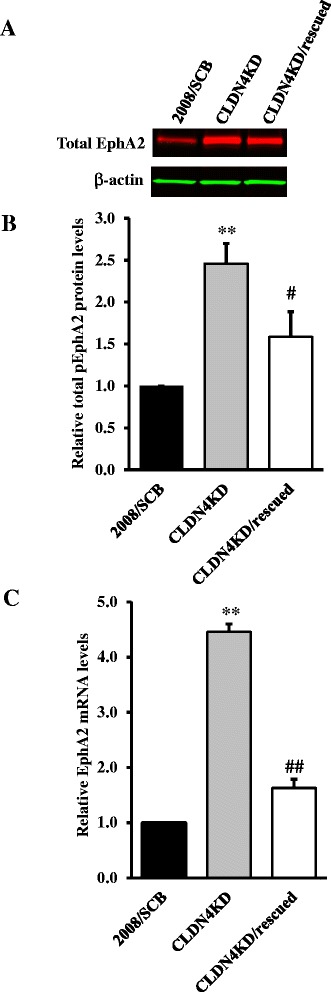
Effect of CLDN4 on EphA2 expression. (A) Representative Western blot showing that CLDN4 knockdown increased EphA2 level, and that this was partially reversed by re-expression of CLDN4 expression. (B) The histogram shows the mean level of EphA2 protein determined from 3 independent experiments expressed as the fold change relative to that in the scrambled siRNA control 2008/SCB cells after normalization to β-actin. (C) qRT-PCR analysis showing that knockdown of CLDN4 increased EphA2 mRNA level and that this was partially reversed by re-expression of CLDN4. Results are given as mean ± SEM (n = 3–4). ** p < 0.01 versus 2008/SCB; ## p < 0.01 versus CLDN4KD.