
Figure 4.
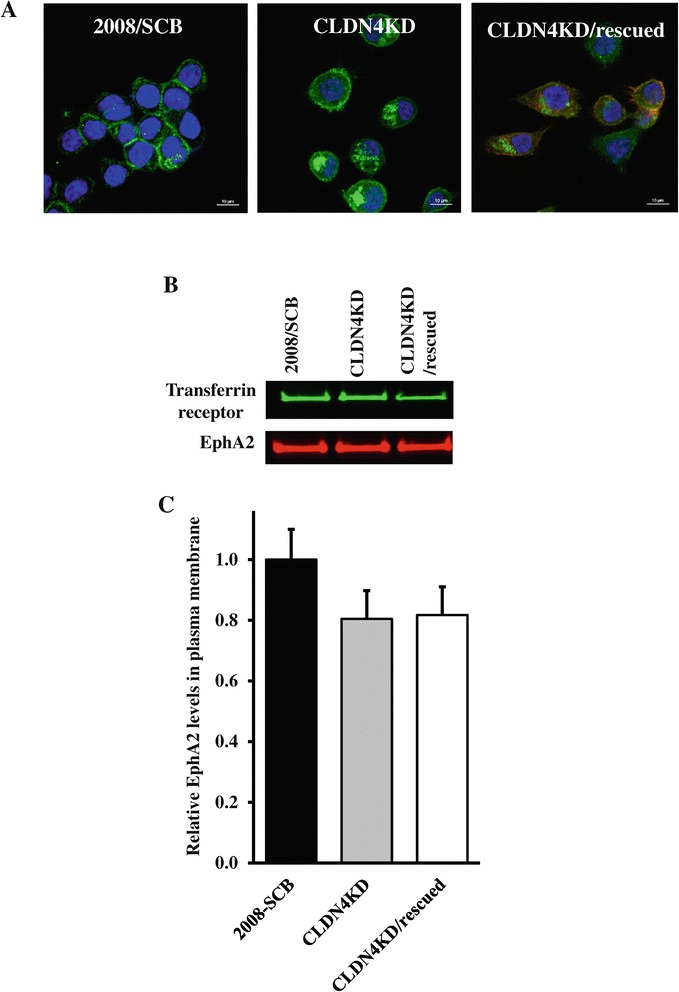
Effect of CLDN4 knockdown on EphA intracellular distribution. (A) The distribution of EphA2 in the 2008/SCB, CLDN4KD and CLDN4KD/rescued cells was visualized by immunofluorescent staining using anti-EphA2 antibody (green). Cell nuclei were counterstained with DAPI (blue). (B) Detection of EphA2 in biotinylated plasma membrane preparations by Western blot analysis using anti-EphA2 and anti-transferrin receptor antibody to provide a lane loading control. (C) Histogram summarizing the results of four independent Western blots.