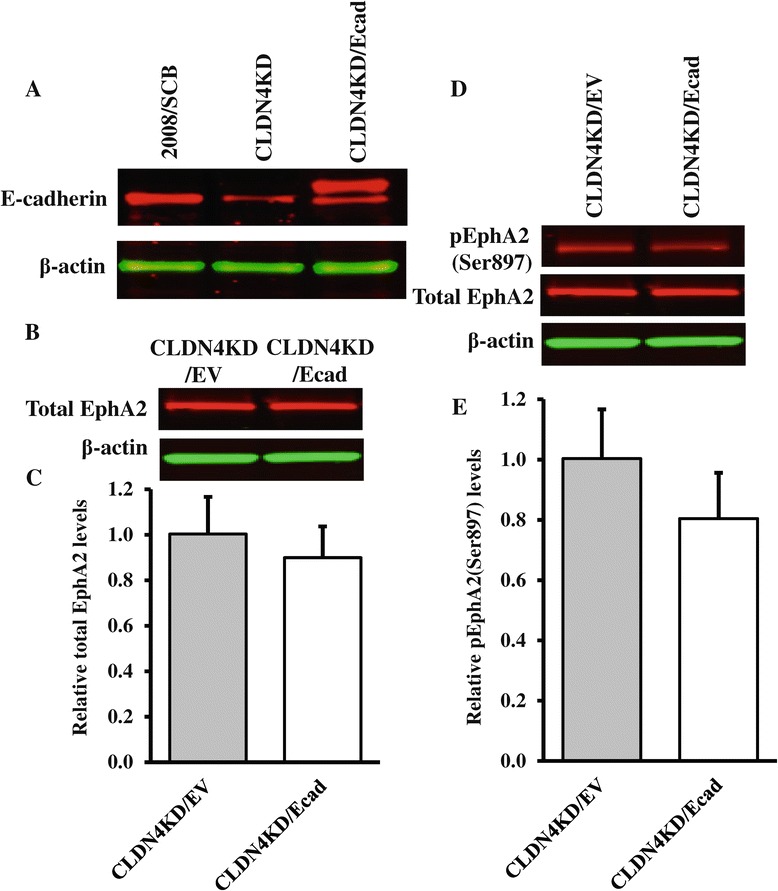
Figure 5.

Re-expression of E-cadherin in CLDN4KD cells does not significantly reduce total or pEphA2-Ser897. (A) Western blot documenting increased expression of total E-cadherin in CLDN4KD/Ecad cells. (B) Representative Western blot showing total EphA2 levels in CLDN4KD/EV and CLDN4KD/Ecad cells. (C) The histogram shows the mean level of total EphA2 protein determined from 3 independent experiments expressed as the fold change relative to that in the empty-vector transfected control CLDN4KD/EV cells after normalization to β-actin. (D) Representative Western blot showing phosph-EphA2 levels in CLDN4KD/EV and CLDN4KD/Ecad cells. (E) The histogram shows the mean phospho-EphA2/total EphA2 ratio in CLDN4KD/EV and CLDN4KD/Ecad cells determined from 3 independent experiments. The data are expressed as mean ± SEM (n = 3).
