
Figure 6.
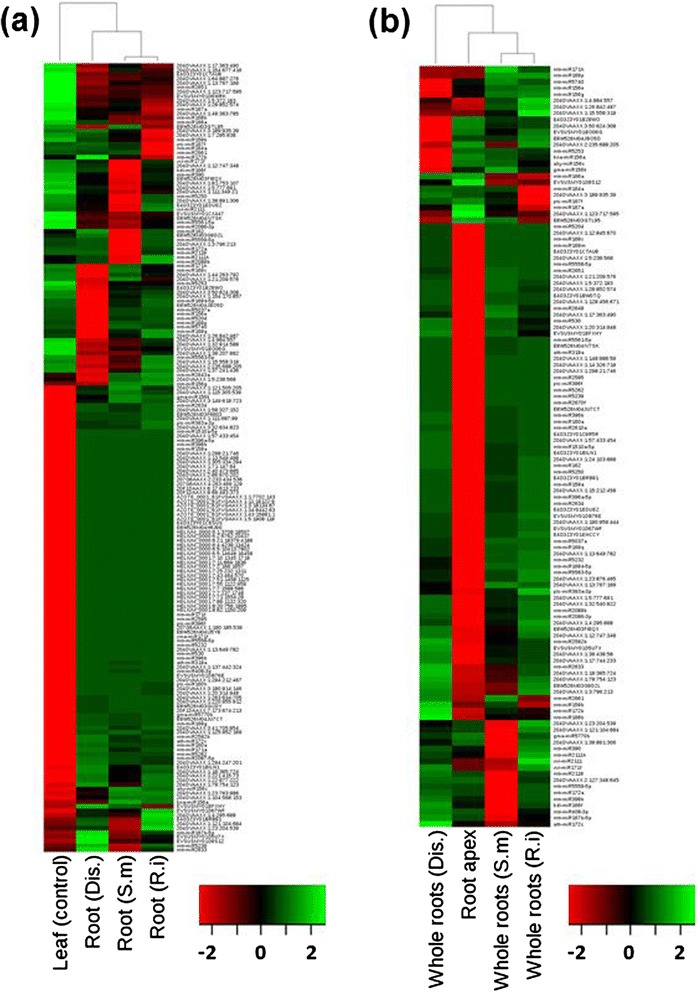
Heatmaps of differential ly expressed miRNAs from different organs of M. truncatula. (a,b) Heat maps from root libraries versus leaf library (a) and root libraries versus root apex libraries (b). Each column corresponds to the different libraries. miRNA IDs are indicated on the right of the diagram and each row indicates a miRNA. Color gradients indicate the expression level from green (low) to red (high) according to read numbers. miRNAs were declared as differentially expressed if the adjusted treatment P-value was <1 × 10⁻³. P-values were adjusted to control the false discovery rate using the Benjamini-Hochberg method. Clustering was based on Pearson correlation coefficient and 'average' algorithm. Dis., Disease library; S.m., Sinorhizobium meliloti; R.i., Rhizophagus irregularis.