Fig. 1.

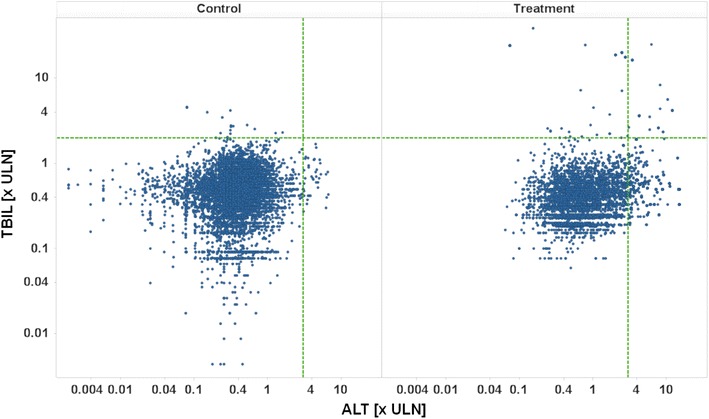
eDISH plot, TBIL [× ULN] vs. ALT [× ULN] on a log/log scale, treatment by panel, pooled active versus control. ULN upper limit of normal, ALT alanine aminotransferase, TBIL total bilirubin

eDISH plot, TBIL [× ULN] vs. ALT [× ULN] on a log/log scale, treatment by panel, pooled active versus control. ULN upper limit of normal, ALT alanine aminotransferase, TBIL total bilirubin