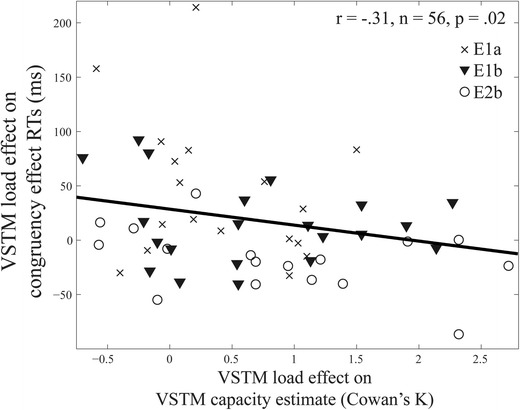
Fig. 4.

Scatterplot with individual data points from the three experiments that employed a visual short-term memory (VSTM) task illustrating the relationship between the VSTM load effect on the congruency effect response times (RTs; y axis) and on VSTM capacity estimates (x axis; Cowan’s K). The line represents the least square linear fit
