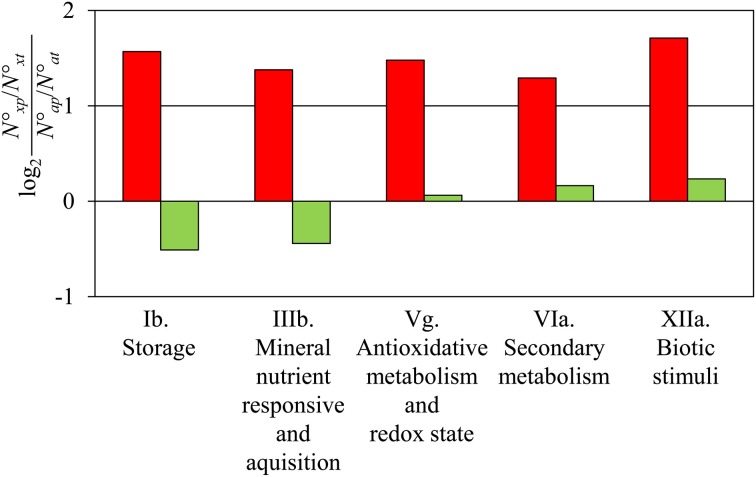
Figure 1.
Comparison of gene expression at 72 hpe vs. 24 hpe. The five functional categories (Ib. Storage, IIIb. Mineral nutrient responsive and acquisition, Vg. Antioxidative metabolism and Redox state, VIa. Secondary metabolism, XIIa. Biotic stimuli, according to Table S1) showed a 2-fold higher number of up-regulated genes than expected by chance in the comparison 72 vs. 24 hpe (red columns). No category was detected with a significant 2-fold higher or lower number of down-regulated genes (green columns). N°xp, number of up- or down-regulated genes of a particular category, N°xt, number of all genes in the category; N°ap, number of all up- or down-regulated genes; N°at, number of all genes.

