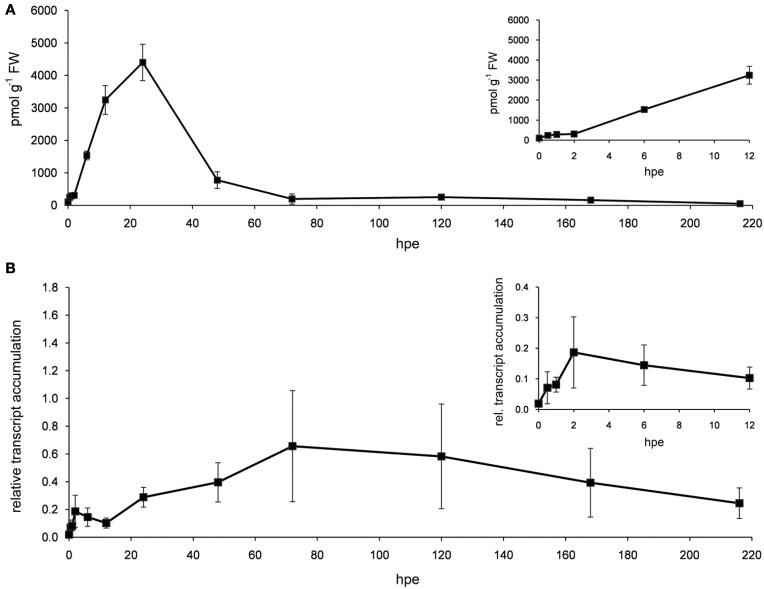
Figure 3.
ACC and ACO transcript levels. Stem bases of cutting were harvested at different time points after excision and used for measuring the accumulation of ACC (A) and transcripts of PhACO1 (B). Relative transcript accumulation in (B) was determined using PhCyRiPro as constitutively expressed gene. Shown are means and standard deviations of three biological replicates. Insets show details of early time points.

