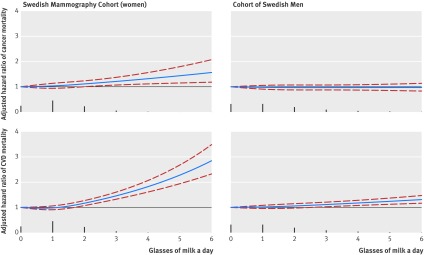
Fig 3 Sex specific multivariable adjusted spline curves of relation between milk intake with time to death from all cancer and cardiovascular disease (CVD). Covariates were age, total energy intake, body mass index, height, educational level, living alone, calcium supplementation, vitamin D supplementation, ever use of cortisone, healthy dietary pattern, physical activity, smoking status, and Charlson’s comorbidity index. The spike plot represents the distribution of milk intake. One glass of milk corresponds to 200 g

An official website of the United States government
Here's how you know
Official websites use .gov
A
.gov website belongs to an official
government organization in the United States.
Secure .gov websites use HTTPS
A lock (
) or https:// means you've safely
connected to the .gov website. Share sensitive
information only on official, secure websites.
