
Figure 3. RIXS spectra of Na3Ir3O8 single crystal and polycrystalline Na4Ir3O8 at Ir L3-edge.
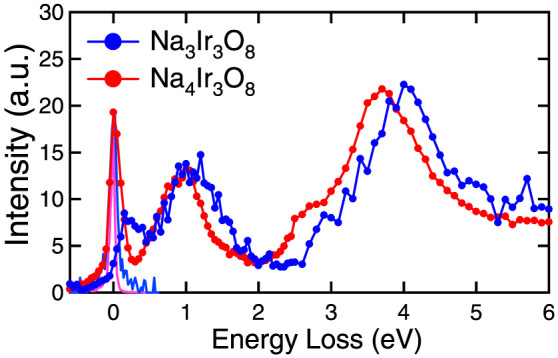
The two spectra were normalized by the intensity of the high energy tail above 6 eV. The blue and pink solid lines around zero energy show the normalized elastic signals independently measured with σ-polarized incident X-ray.