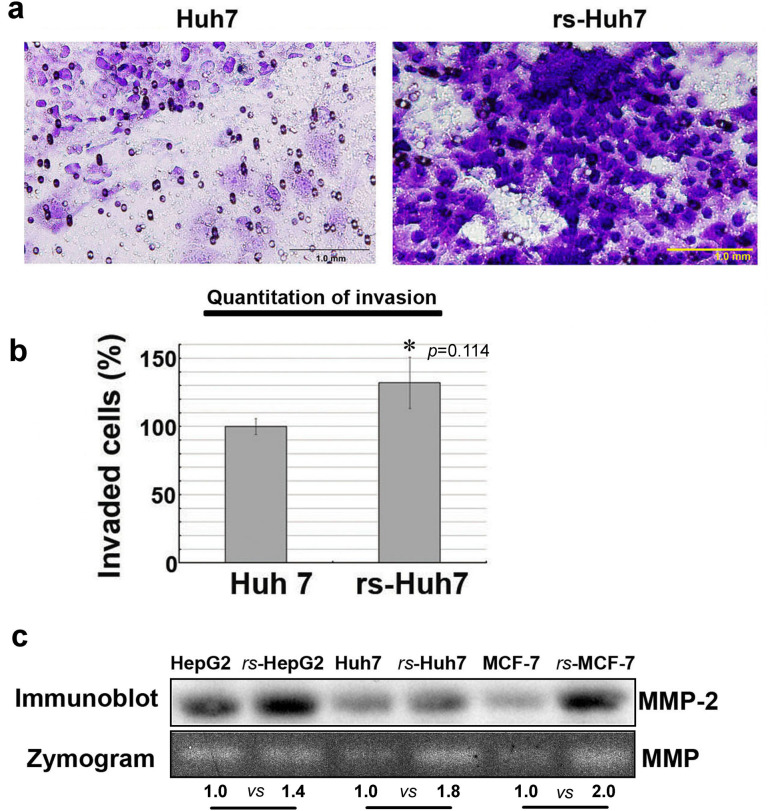
Figure 5. rs-monolayer cells are highly invasive than the parental population.
(a) An invasion assay showing rs-Huh7 cells have higher invasiveness compared to the parental population. (b) Histogram shows the percentage of migration, * indicates the p-value from statistical analysis and (c) the immunoblot and zymogram show an increase in the expression and activity of MMPs, respectively in rs-monolayer population. Numbers at the bottom of the zymogram image are densitometry quantifications of respective signals. The square-boxes bordering the gel image in the immunoblot as well as the zymogram gel indicate the area of the image cropped from the original blot and gel, respectively. The uncropped original images of the immunoblot (Supplementary Fig. S8) and zymogram gel (Supplementary Fig. S9) are provided in the “supplementary information”.

