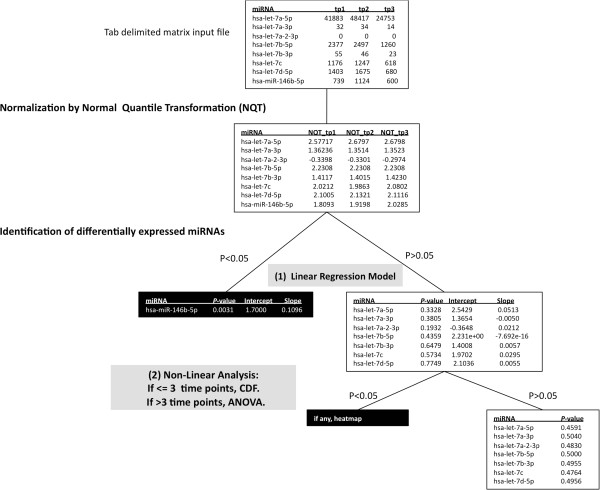
Figure 1.
An overview of the mirnaTA workflow using a three time point example. mirnaTA converts the tab-delimited, matrix raw data into quantiles using Normal Quantile Transformation (NQT). Then, using a linear regression model, mirnaTA identifies miRNA species which either increase or decrease linearly. Any miRNA species with P < 0.05 are considered to be statistically significant (shown in the black box). miRNAs that did not fit into a linear model with statistical significance are further analyzed using either cumulative distribution function (CDF) or analysis of variance (ANOVA) depending on the number of time points.

