
Figure 4.
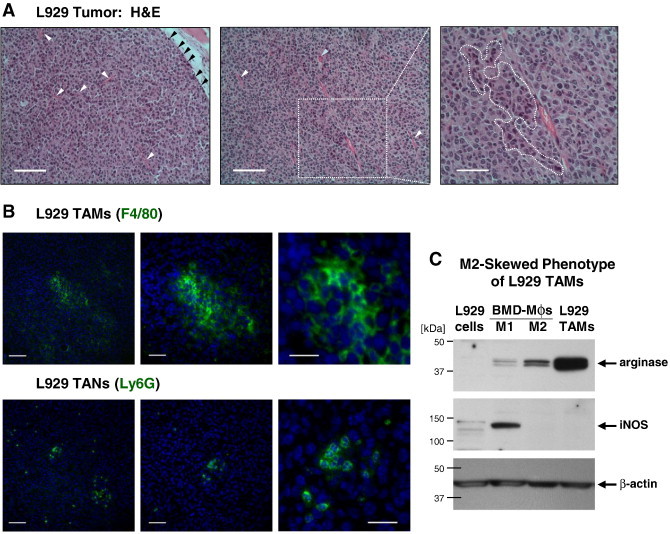
TAMs and TANs in murine L929 tumors. (A) Left: Outer portion of L929 tumor depicting tumor-stroma border infiltrated with leukocytes (black arrowheads). Several blood vessels are indicated by white arrowheads. Bar, 100 μm. Middle: Inner portion of the same L929 tumor depicting lumen-containing blood vessels, some with neutrophils (blue arrowhead). Bar, 100 μm. Right: An island of macrophage-like leukocytes characterized by dark blue–stained nuclei and highly eosinophilic cytoplasm is outlined. Bar, 50 μm. (B) L929 TAMs (top) and TANs (bottom) highlighted by immunofluorescent staining (green) for F4/80 and Ly6G, respectively. Images to the right depict areas examined at increasing magnifications. Bars, 100 μm, 50 μm, and 25 μm in left, middle, and right panels, respectively. (C) Western blot analysis of L929 TAMs for expression of arginase-1 and iNOS. Parental L929 tumor cells and L929 TAMs analyzed in comparison with the lysates of WT M1 or M2 polarized BMD macrophages (Mϕs), providing positive control for iNOS (~ 130 kDa) and arginase-1 (~ 38 kDa), respectively. After stripping, the upper portion of the membrane was reprobed for ~ 42-kDa β-actin to confirm equal protein loading.