
Figure 6.
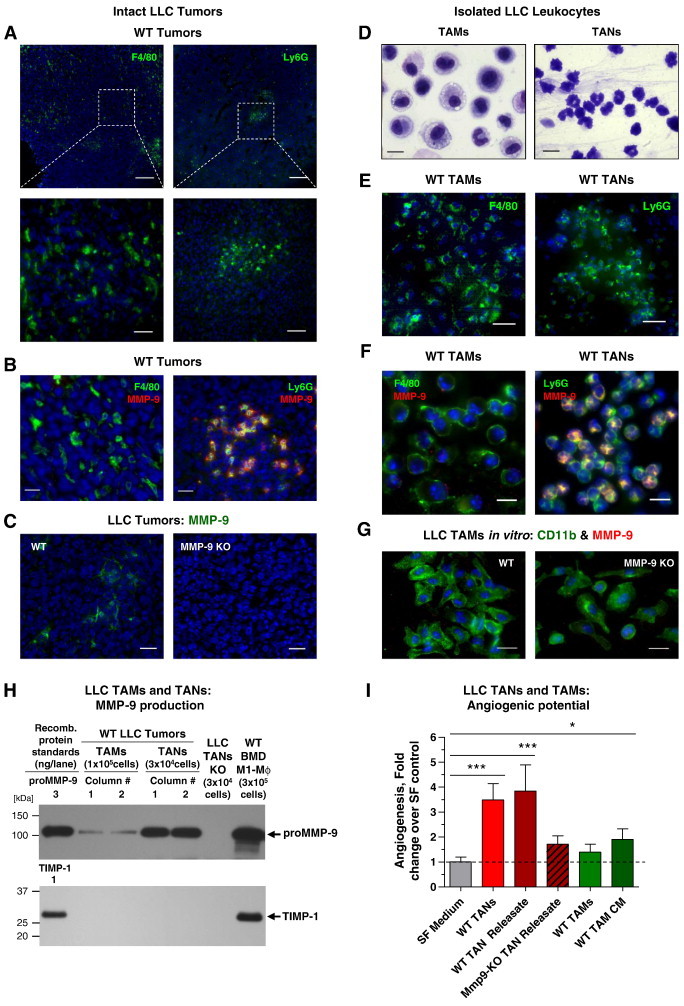
Analysis of TAMs and TANs from LLC tumors grown in WT and Mmp9-KO hosts. (A) LLC tumor from WT mice was immunostained for macrophage F4/80 (left) and neutrophil Ly6G (right) markers (green). Bars, 200 μm (top) and 25 μm (bottom). (B) WT-LLC tumor was double-stained for MMP-9 (red) and either F4/80 (left) or Ly6G (right) markers (green). Bars, 20 μm. (C) Staining of WT and MMP-9 KO LLC tumors for MMP-9 (green). Bars, 25 μm. (D) HEMA staining of TAMs and TANs isolated from WT LLC tumors. Bars, 10 μm. (E) Isolated WT LLC TAMs (left) and TANs (right) stained for macrophage (F4/80) and neutrophil (Ly6G) markers (green). Bars, 25 μm. (F) Isolated WT LLC TAMs (left) and TANs (right) were double-stained for murine MMP-9 (red) and either F4/80 (left) or Ly6G (right) markers (green), respectively. Bars, 10 μm. (G) LLC TAMs isolated from WT (left) or MMP-9 KO mice (right) were double-stained for myeloid cell marker CD11b (green) and MMP-9 (red). Note the absence of strong MMP-9 signal in TAMs from both tumors. (H) Samples of 48-hour CM from 1 × 10⁵ TAMs or releasates from 3 × 10⁴ TANs isolated from two WT and one Mmp9-KO LLC tumor were analyzed by Western blot analysis for MMP-9 and TIMP-1. CM from WT BMD M1 Mϕs, producing both proMMP-9 and TIMP-1, provided positive control (right lane). (I) TANs and TAMs were isolated from WT or Mmp9-KO LLC tumors and analyzed for their angiogenesis-inducing capacity as intact cells or as TAN releasate and TAM CM. Pooled data from three independent experiments, each employing from four to six embryos grafted with four to six onplants per variant are presented. Data are means ± SEM. *P < .05, **P < .005, ***P < .0001.