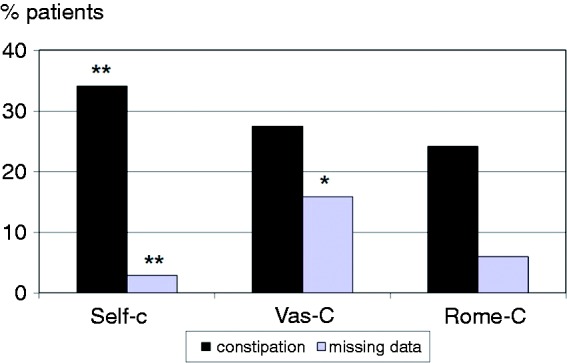
Figure 1.

Frequency of constipation and missing data in 1306 patients answering questionnaires on constipation during a GP visit.
Self-C: self-reported constipation (positive answer at the direct question: ‘Do you consider yourself suffering of constipation?’); VAS-C: constipation measured by a visual analogue scale (score >2 out of 10 cm); Rome-C: constipation defined according to the Rome III Criteria
*p = .0.01 vs. Rome-C by chi-squared test.
**p = 0.01 vs. VAS-C and Rome-C by chi-squared test.
