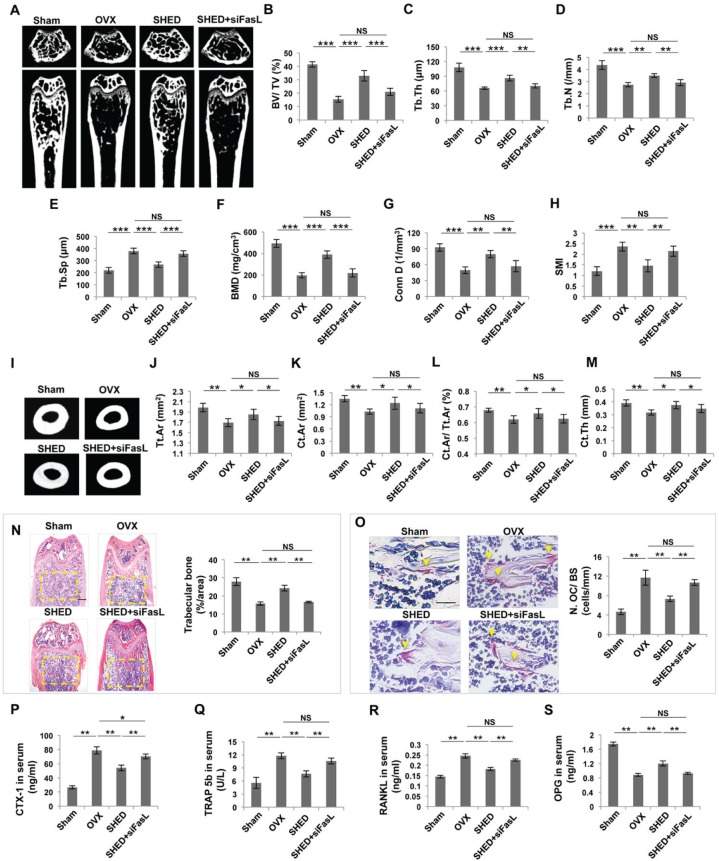
Figure 5.
Transplantation of FasL knockdown SHED failed to ameliorate the osteoporotic phenotype in OVX mice. (A) μCT image showed that OVX mice had reduced trabecular bone volume in the femurs compared with the sham mice. SHED, but not FasL knockdown SHED, transplantation increased trabecular bone volume in the femurs of OVX mice. (B-H) μCT analysis showed that SHED, but not FasL knockdown SHED, transplantation increased bone volume (BV/TV), trabecular thickness (Tb.Th), trabecular number (Tb.N), bone mineral density (BMD), and connectivity density (Conn.D), along with reduced trabecular space (Tb.Sp) and structure model index (SMI) in the femurs of OVX mice. (I) μCT images showed that SHED, but not FasL knockdown SHED, transplantation increased cortical bone volume in the femurs of OVX mice. (J-M) μCT analysis showed that SHED, but not FasL knockdown SHED, transplantation improved total cross-sectional area (Tt.Ar), cortical bone area (Ct.Ar), cortical bone fraction (Ct.Ar/Tt.Ar), and cortical thickness (Ct.Th) in the femurs of OVX mice. (N) Hematoxylin and eosin (H&E) staining showed that SHED, but not FasL knockdown SHED, transplantation increased trabecular bone area (yellow circled area) in distal femurs of OVX mice, as analyzed by ImageJ software. (O) TRAP staining showed that SHED, but not FasL knockdown SHED, transplantation reduced the number of TRAP+ cells (yellow arrows) in the femurs of OVX mice. (P-S) ELISA analysis showed that FasL knockdown SHED transplantation failed to regulate the serum levels of CTX-1, TRAP 5b, RANKL, and OPG in OVX mice in comparison with the SHED transplantation group. n = 5 in each group. Scale bar = 200 μm; *p < .05; **p < .01; ***p < .005. Error bars: mean ± SD.

