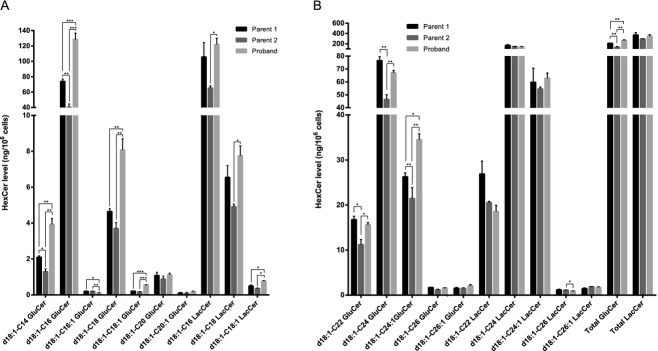
Figure 5.

Lipid profile of glycosylceramide species in proband fibroblasts. Lipid extracts, prepared from cultured fibroblasts were analyzed using LC-MS. Glycosylceramide species containing long-chain fatty acids are shown in (A), while glycosylceramide species with very long-chain fatty acids are shown in (B). Lipids levels were normalized to total cell number and internal standards. Three independent cultures of fibroblasts from the proband and controls were analyzed. Mean ± SD is shown, N = 3. Statistical analyses were performed using multiple t-test with significance levels: *(P < 0.05) and **(P < 0.01).
