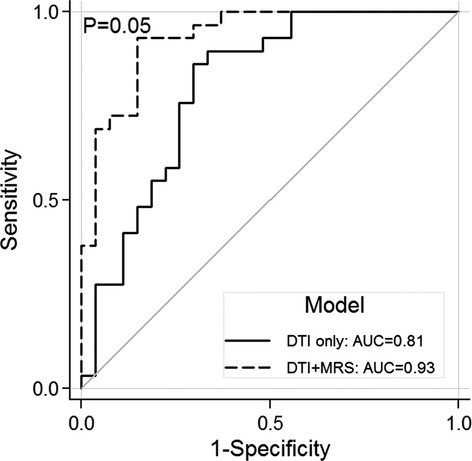
Figure 3.

Significant increase in diagnostic accuracy combining magnetic resonance spectroscopy (MRS) and diffusion tensor imaging (DTI) measures. Receiver operating characteristic (ROC) curves comparing DTI diagnostic test accuracy model to combined DTI and MRS model. Solid ROC curve represents the model using DTI fractional anisotropy values. Dashed ROC curve represents the model using DTI fractional anisotropy, MRS N-acetylaspartate, MRS myo-inositol, and MRS γ-aminobutyric acid values combined.
