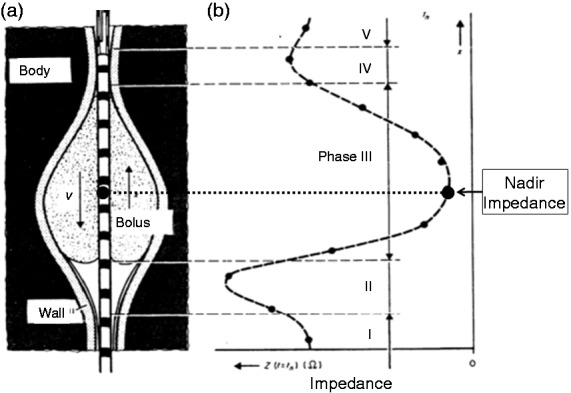
Figure 1.

Estimation of the impedance changes caused by a bolus with air in front of it moving along the oesophagus. (a) Illustration of bolus shape and movement. (b) Spatial distribution of impedance along the catheter. Interpolation between discrete impedance values is shown as dotted lines. The nadir level of impedance corresponds approximately to the position of maximum bolus accumulation (axial centre). Drawing adapted from Silny et al.43 (1993) modified for purposes of simplification.
