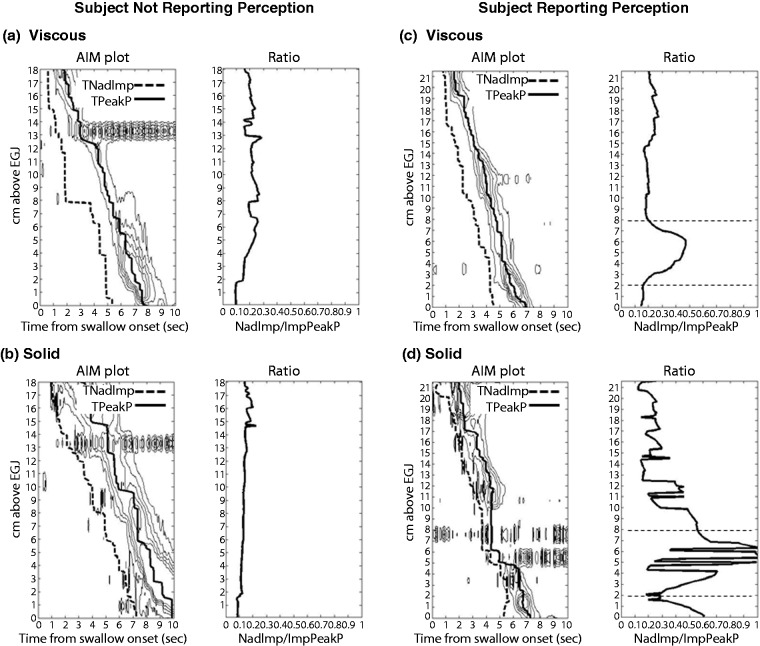
Figure 5.
Calculation of the impedance ratio along the oesophagus using automated impedance manometric (AIMplot) software. Example viscous and solid swallows are shown from a individual who reports no-bolus bolus perception ((a) and (b)) and an individual who perceives bolus passage for solids ((c) and (d)). Plots (left) show pressure contour plots (with iso-contours starting at 20 mmHg) with time of nadir impedance (TNadImp) and time of peak pressure (TPeakP) superimposed. Graphs (right) show the impedance ratio. The participant with bolus perception reported bolus stepwise or slow passage during the solid swallow, suggesting that some stasis had occurred. For this subject, both viscous and solid swallows ((c) and (d)) demonstrate a focal region of higher impedance ratio in the distal oesophagus between 2 cm and 8 cm above the oesophagogastric junction (EGJ) (this region is demarcated in graphs right by horizontal dotted lines). In the case of the solid swallow (d), a peristaltic break is also visible within this region, which would be compatible with incomplete bolus transit. From Omari et al.59 (2013). Reproduced with permission.

