
Figure 2.
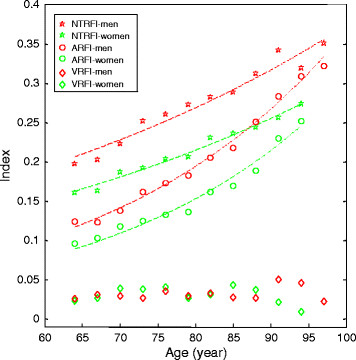
Risk-factor indices in relation to age. The indices containing vascular risk factors (VRFIs; n = 4), nontraditional risk factors (NTRFIs; n = 19), and all risk factors (ARFIs; n = 42) are presented as a function of age in men (green) and in women (red). Symbols represent the observational data as means for 3-year age groups; lines represent curve fitting. The nontraditional and all factor indices increased exponentially with age (for example, R2 = 0.981 in men and R2 = 0.939 in women for the NTRFI; R2 = 0.982 in men and R2 = 0.987 in women for the ARFI; P < 0.001 in each case).