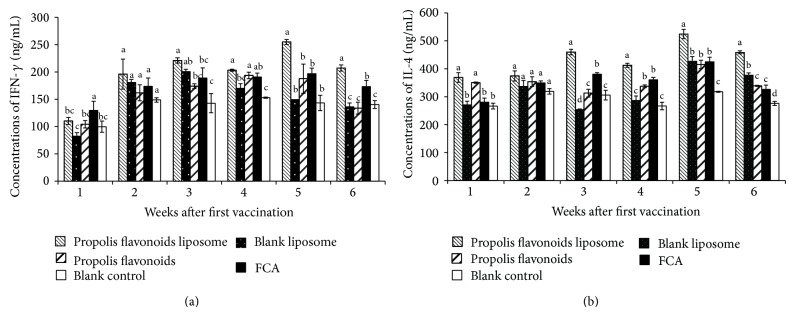
Figure 5.

The dynamic change of concentrations of IFN-γ and IL-4 after vaccination. On weeks 0, 1, 2, 3, 4, 5, and 6 after first vaccination, the concentrations of IFN-γ and IL-4 in serum were determined by ELISA kits. Values are mean ± SEM, n = 4 mice/group. a–d The superscripts without the same letters above the columns differ significantly (P < 0.05) from each other in the same concentration group.
