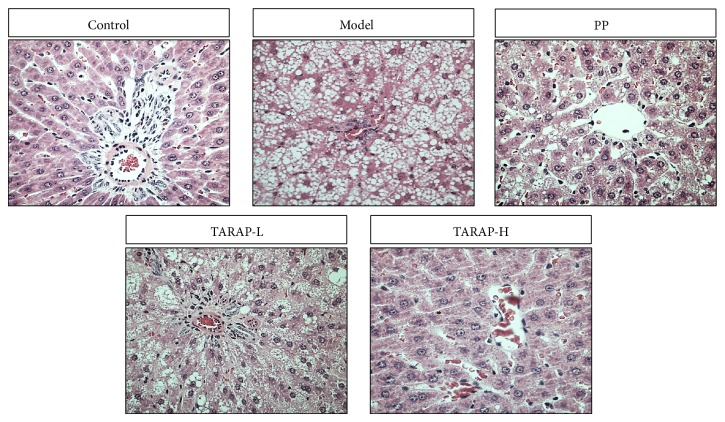
Figure 1.
Effects of TARAP on hepatic morphology in mHFD rats. Control: “−”, no fat; model: “+++”, fatty hepatocytes occupying >66% of the hepatic parenchyma. PP: “+”, fatty hepatocytes occupying 33% of the hepatic parenchyma; TARAP-L: “++”, fatty hepatocytes occupying 33–66% of the hepatic parenchyma; TARAP-H: “+”, fatty hepatocytes occupying 33% of the hepatic parenchyma; representative images were taken at a magnification ×400.

