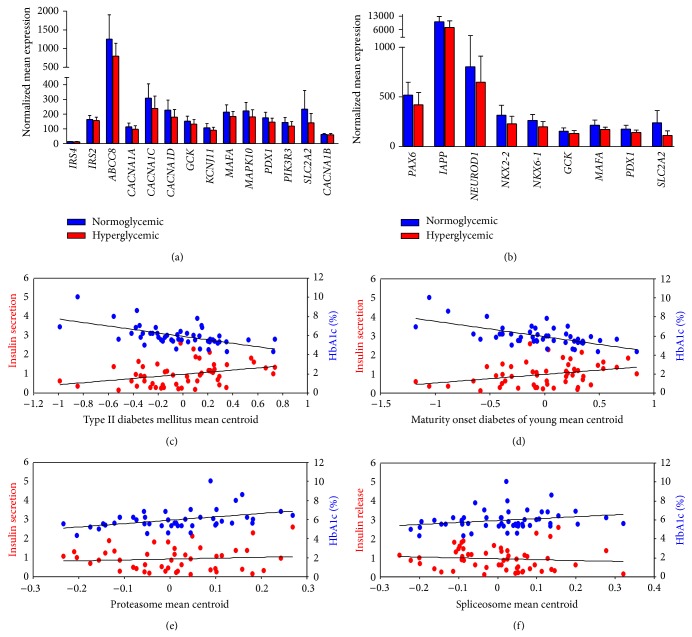
Figure 2.
Genes differentially expressed in T2DM and MODY pathways. Gene expression analysis of genes in the T2DM and MODY pathway showed that 14 out of the 45 genes of the T2DM (a) pathway (P < 0.05) and 9 out of 24 genes of MODY (b) (P < 0.05) have lower expression in hyperglycaemic compared to normoglycemic donors. (c) Correlation of mean centroid of the 14 downregulated genes in T2DM pathway showed positive correlation with insulin secretion (R = 0.33; P = 0.01) and negative correlation with HbA1c level (R = −0.57; P = 0.00001). (d) Correlation of mean centroid of the 9 downregulated genes in MODY pathway showed positive correlation with insulin secretion (R = 0.31; P = 0.01) and negative correlation with HbA1c level (R = −0.59; P = 0.000006). (e) Correlation of mean centroid of the 31 upregulated genes in proteasome pathway showed no correlation with insulin secretion (R = −0.05; P = 0.7) and positive correlation with HbA1c level (R = 0.3; P = 0.03). (f) Correlation of mean centroid of the 55 upregulated genes in spliceosome pathway showed no correlation with insulin secretion (R = 0.16; P = 0.23) and positive correlation with HbA1c level (R = 0.26; P = 0.06).

