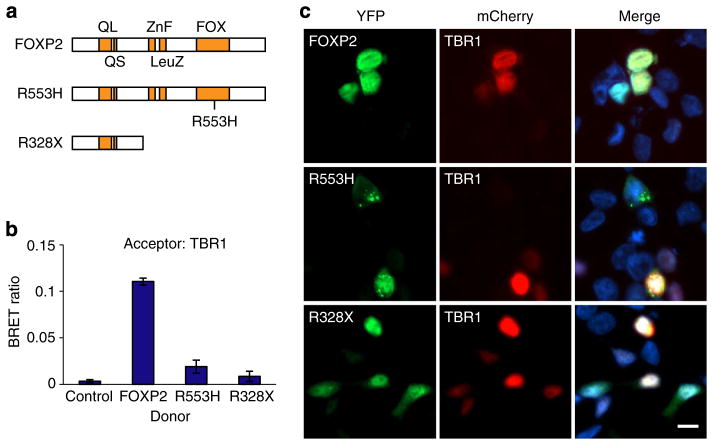
Figure 7. FOXP2 variants found in speech/language disorders do not interact with TBR1.
(a) Schematic representation of FOXP2 variants found in speech/language disorders. (b) BRET assays for interaction of WT TBR1 with FOXP2 variants. (c) Fluorescence images of HEK293 cells co-transfected with TBR1 and FOXP2 variants. FOXP2 variants fused to YFP are shown in green (left-hand side), whereas TBR1 fused to mCherry is shown in red (middle). Nuclei were stained with Hoechst 33342 (blue). Scale bar, 10 μm. Concordant results were seen in SHSY5Y cells, as shown in Supplementary Fig. 7. In b, bars represent the corrected mean BRET ratios±s.e.m. of one experiment performed in triplicate. BRET assays were performed in HEK293 cells.

