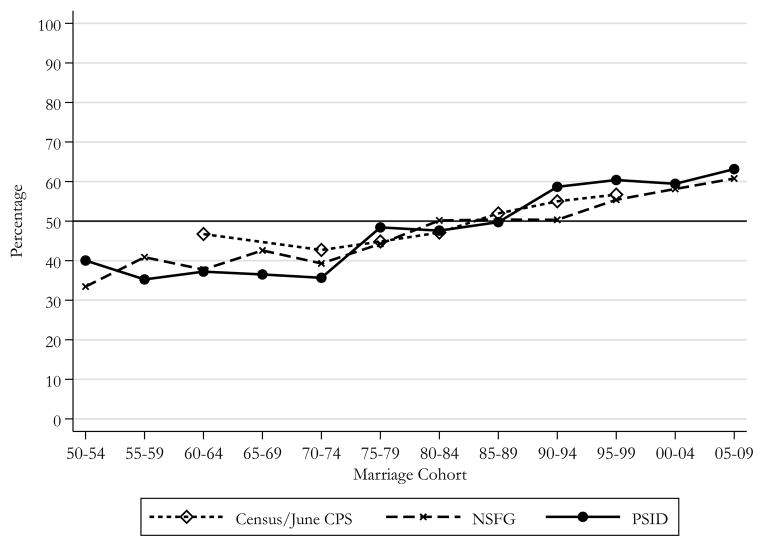
Figure 1.
Percentage Hypogamous (W>H) Given Heterogamy (W≠H) by Marriage Cohort and Data Source
Notes: W=wife’s education category; H=husband’s education category. Education categories are <12, 12, 13–15, ≥16.
Sources: Pooled data from the 1960, 1970, and 1980 decennial U.S. census (IPUMS) and the 1971–1995 June Current Population Survey (CPS); 1973, 1976, 1982, 1988, 1995, 2002, and 2006–10 National Survey of Family Growth (NSFG); and the 1968–2009 Panel Study of Income Dynamics (PSID).

