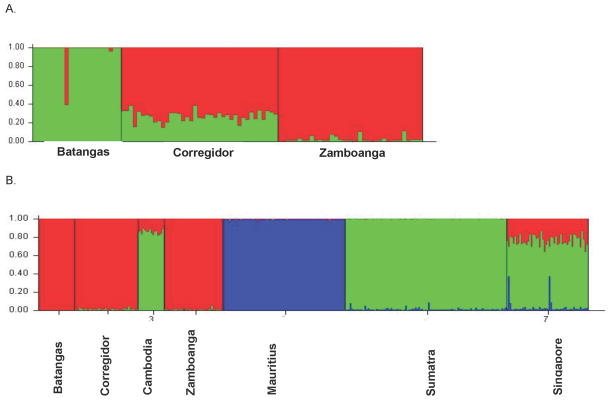
Figure 3.

A. STRUCTURE plot of three Philippine populations (Batangas, Corregidor and Zamboanga) with K=2 based on genotypes at 15 STR loci. Batangas and Zamboanga are well differentiated in the plot with Corregidor showing admixture of approximately 25% and 75% with each of the two populations. B. STRUCTURE plot of all seven populations of cynomolgus macaques based on STRs when K=3. Note that the three Philippine populations for a single group that is well differentiated from populations from Sumatra and Mauritius.
