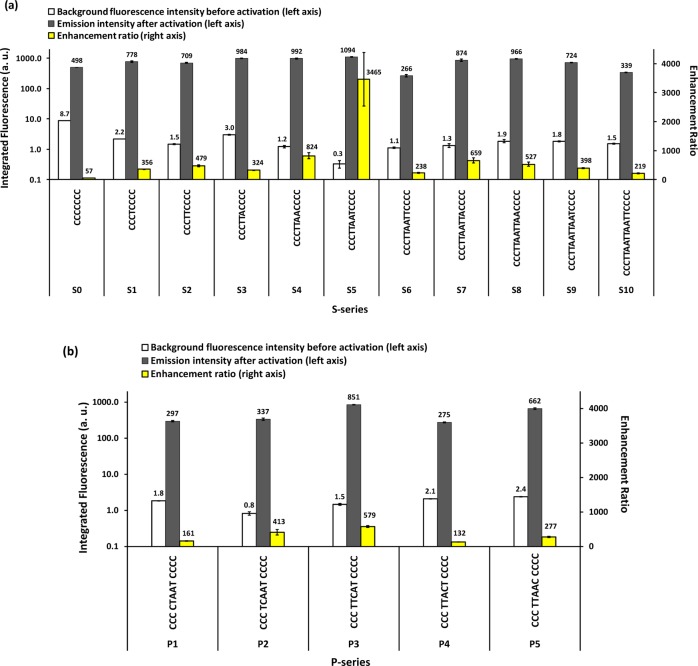
Figure 3.
Enhancement ratios of the (a) S- and (b) P-series. The enhancement ratios were estimated based on the 1D scans using a fixed excitation wavelength of 580 nm and calculated as (Iactivated – Ibuffer)/(Iinactivated – Ibuffer). Fluorescence intensities before and after activation were integrated from 595 to 740 nm.

