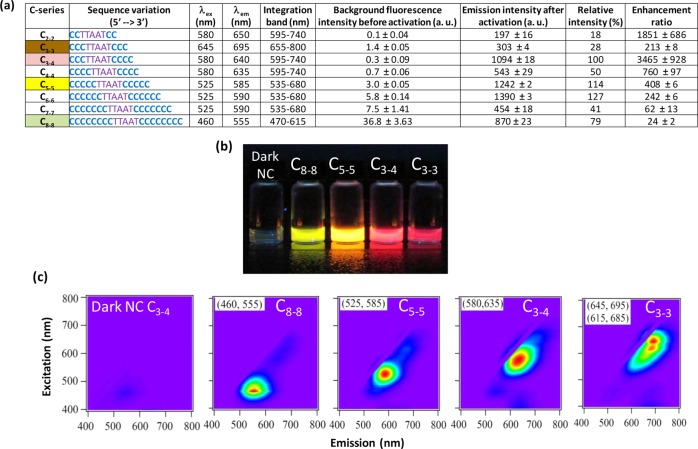
Figure 4.
(a) Enhancement ratios of the C-series NCBs. Here λex and λem represent excitation and emission wavelengths of the major spectral peak for each NCB. The brightness and enhancement ratio of each NCB were estimated based on the 1D scans using the associated λex for excitation. Fluorescence intensities before and after activation were integrated over different spectral bands but with a fixed bandwidth of 145 nm. The integrated intensity of the gold standard, C3–4, after activation was set to 100% for comparison. (b) Color photo of four selected NCBs under UV (365 nm) excitation. The vial on the left was the inactivated C3–4 NCB (i.e., C3–4 NC probe with dark silver clusters, without the enhancer probe). (c) Normalized 2D fluorescence contour plots of the selected NCBs. Three of the four NCBs (green/C8–8, yellow/C5–5, and red/C3–4) were relatively spectrally pure.

