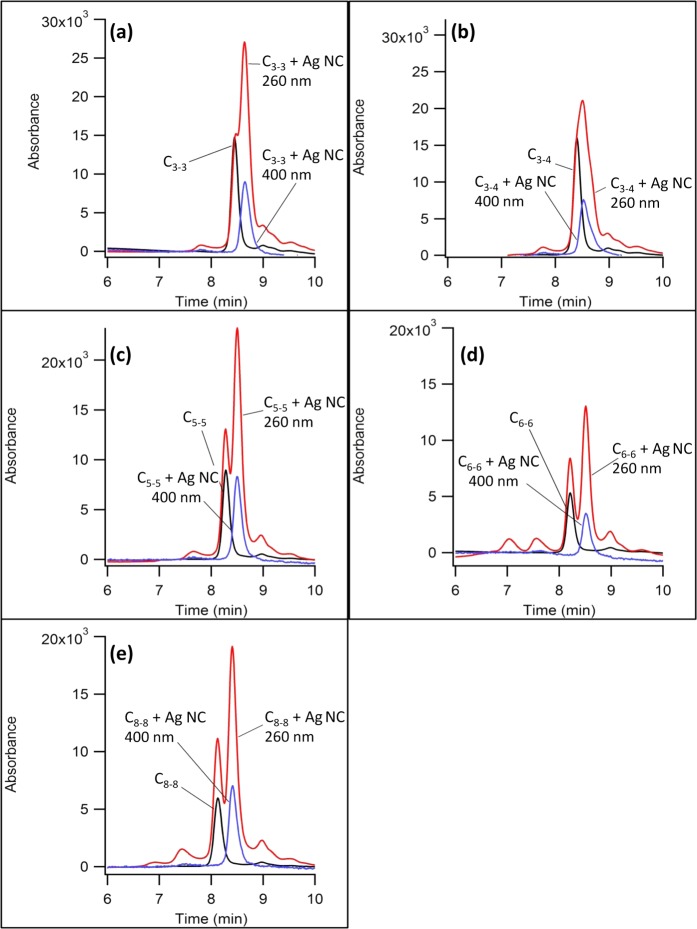
Figure 5.
Size exclusion chromatograms for the NC probes without (black lines) and with (red and blue lines) dark silver clusters. The blue lines are cluster-specific because the absorption was collected at 400 nm. The red lines are DNA-specific because the absorption was collected at 260 nm. The NC probes are (a) C3–3, (b) C3–4, (c) C5–5, (d) C6–6, and (e) C8–8.

