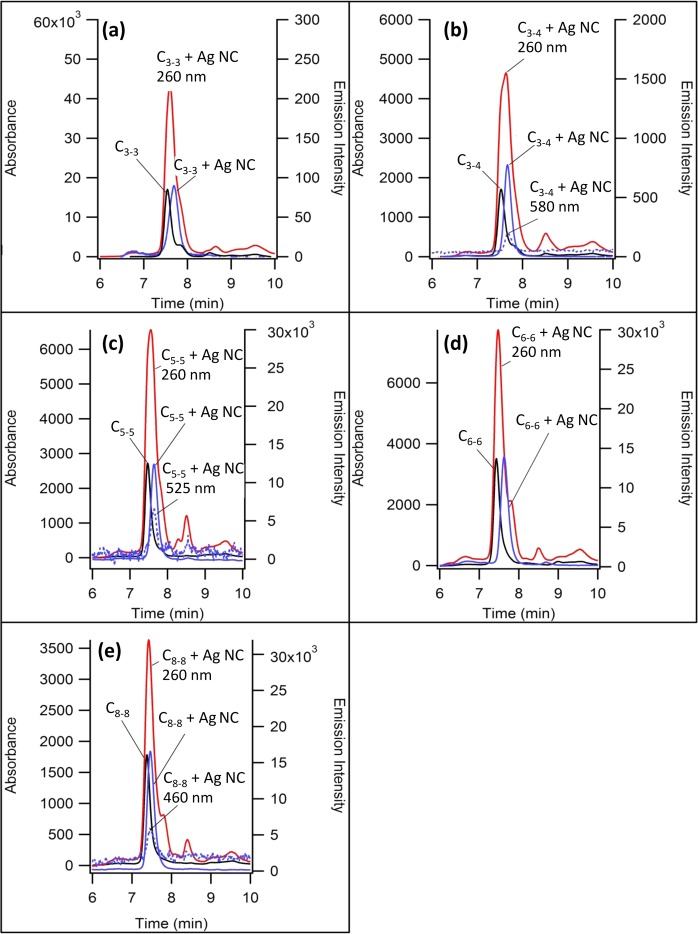
Figure 6.
Size exclusion chromatograms for the duplexes without (black lines) and with (red and blue lines) silver clusters. The solid blue lines are cluster-specific because the emission was collected with (a) ex/em (nm): 645/695 for C3–3, (b) 580/640 for C3–4, (c and d) 525/585 for both C5–5 and C6–6, and (e) 460/490 for C8–8. The red lines are DNA-specific because the absorption was collected at 260 nm. The NCBs are (a) C3–3, (b) C3–4, (c) C5–5, (d) C6–6, and (e) C8–8.

