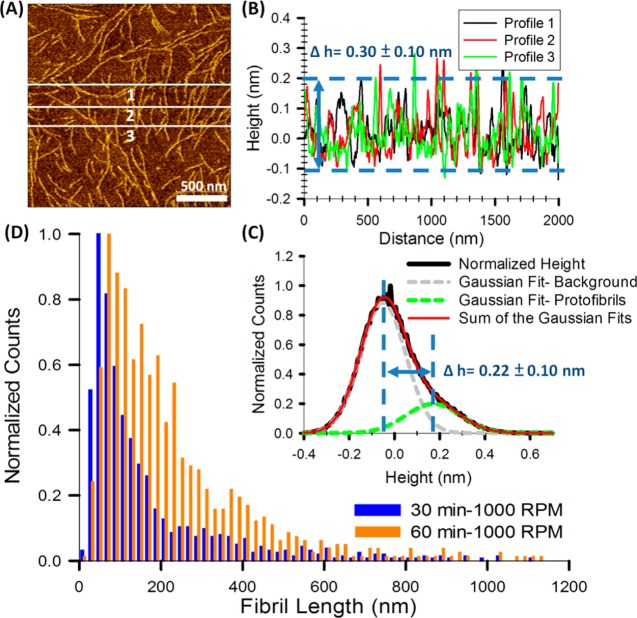
Figure 4.
(A) Representative AFM image of 60 min/1000 rpm Aβ12–28 sample. (B) Line profile of the three white lines indicated in (A). (C) Normalized height distribution of the image shown in (A). Two Gaussian functions are fit to the data. The Gaussian peak on the left (gray) shows the position of the mica substrate and highlights the roughness of the mica substrate and the AFM noise. The Gaussian peak on the right (green) shows the height distribution of the protofibrils, which is wider than the background noise. (D) Normalized distribution of fibril lengths 30 min/1000 rpm and 60 min/1000 rpm Aβ12–28 samples. The right shift reflects the growth of protofibrils on the surface.

