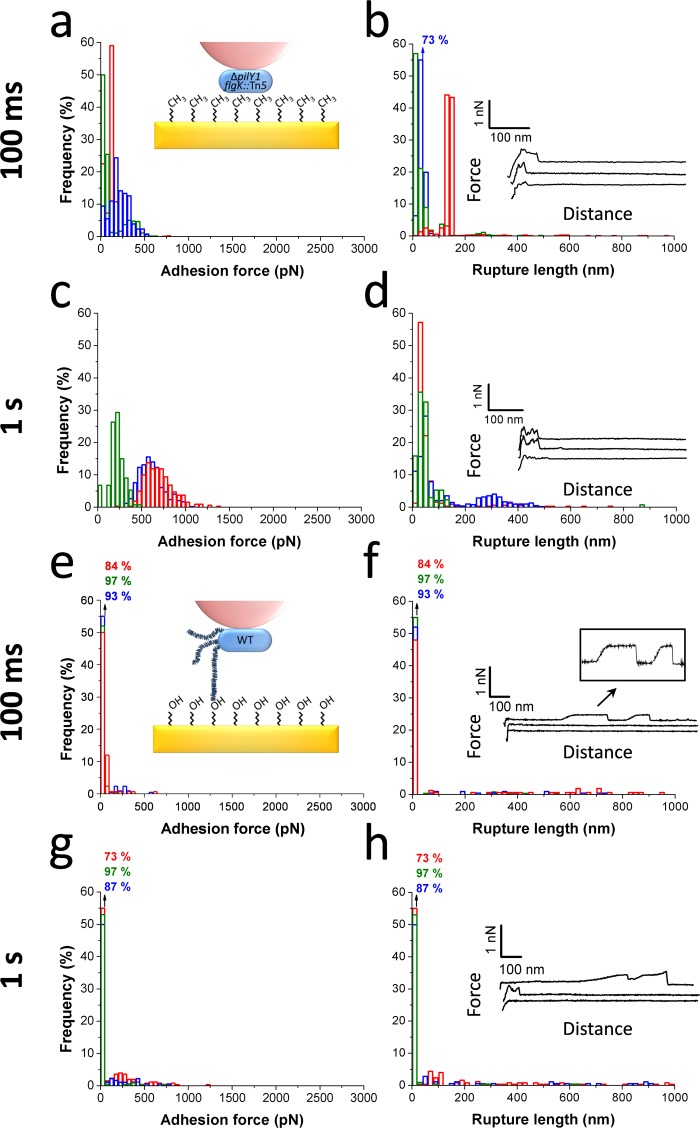
Figure 4.
Role of pili and substrate chemistry in controlling P. aeruginosa single-cell adhesion. (a,c) Adhesion force histograms, (b,d) rupture length histograms, and representative retraction force profiles obtained by recording multiple force–distance curves between cells from the pili-less mutant (ΔpilY1 flgK::Tn5) and hydrophobic substrata at 100 ms (a,b; n = 906, 539, and 502 curves for each cell) and 1.1 s (c,d; n = 132, 592, 320 curves) contact time. (e,g) Adhesion force histograms, (f,h) rupture length histograms, and representative retraction force profiles obtained by recording multiple force–distance curves between WT cells and hydrophilic substrata at 100 ms (e,f; n = 159, 250, 217 curves for each cell) and 1.1 s (g,h; n = 211, 179, and 251 curves for each cell) contact time.

