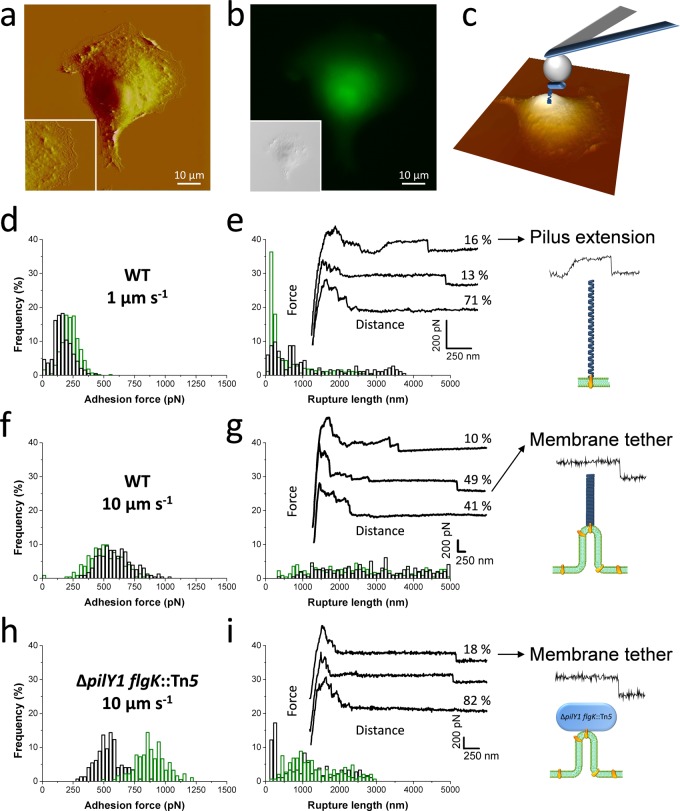
Figure 5.
Single-cell force spectroscopy of the P. aeruginosa–host interaction. (a) AFM deflection image a living A549 pneumocyte cell in buffer (inset: higher magnification of the smooth area). (b) Correlative fluorescence image (inset: corresponding DIC image) of the cell labeled with the fluorescent dye CFSE (green). (c) SCFS was used to quantify the adhesion forces between single P. aeruginosa bacteria (blue) and pneumocytes. For each pneumocyte tested, force curves were recorded on at least three different spots. (d,f) Adhesion force histograms, (e,g) rupture length histograms, and representative retraction force profiles obtained by recording multiple force–distance curves at 1.1 s contact time between WT cells and A549 pneumocytes using a pulling speed of 1.0 μm s–1 (d,e; n = 192 and 434 curves for each cell) and 10.0 μm s–1 (f,g; n = 231 and 223 curves). (h,i) Force data obtained for ΔpilY1 flgK::Tn5 mutant bacteria at 10.0 μm s–1 pulling speed (n = 180 and 146 curves). As illustrated in the cartoons, long-range constant force plateau interactions of two types are observed with WT bacteria: “rough” plateaus reflecting the extension of bacterial pili (e, right panel) and “smooth” plateaus associated with the extraction of host membrane tethers (g, right panel). With ΔpilY1 flgK::Tn5 bacteria, however, only smooth plateaus are observed (i, right panel).

