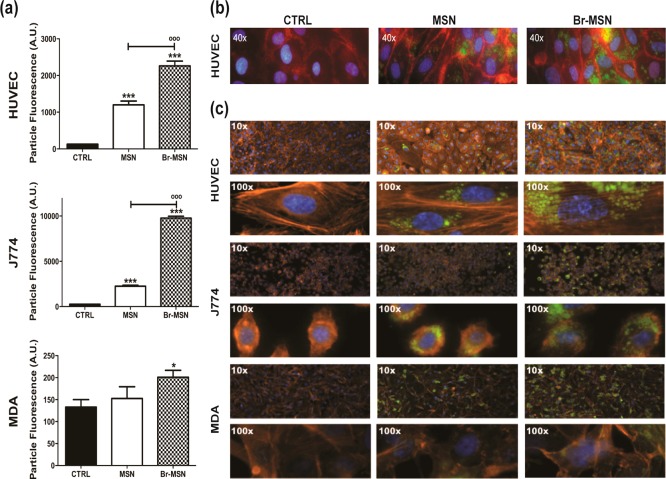
Figure 3.
(a) Internalization of MSN and Br–MSN into MDA, J774 and HUVEC cell lines evaluated through FACS analysis. (b) Wide field epifluorescent micrographs of MSN and Br–MSN effects on intercellular endothelial junctions VE-cadherin (red). The particles are shown in green and the nuclei in blue. (c) Wide field epifluorescent micrographs of MSN and Br–MSN effects on cell actin (red) in HUVEC, J774 and MDA cells lines. The particles are shown in green and the nuclei in blue.

