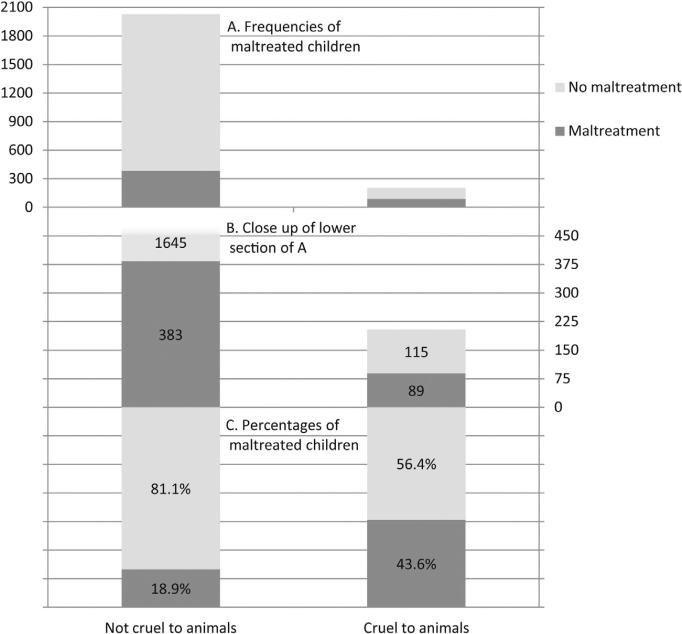
Fig. 2.
Frequencies and percentages of maltreated children in those with or without reports of cruelty to animals. Note: (A) Frequencies of maltreated children in groups with and without reports of cruelty to animals. (B) Close up of lower part of panel A, showing frequencies of maltreated and nonmaltreated children in each group. (C) Percentages of maltreated and non-maltreated children in each group. Not cruel to animals N = 2,028. Cruel to animals, N = 204.

