
Table 1.
Analysis of variance P -values for sweetgum growth and biomass traits assessed following Year 1 of the artificial defoliation study.
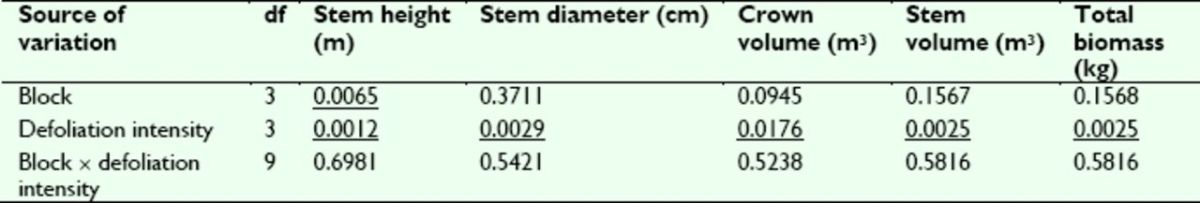
P -values are reported for each main and interaction effect included in the ANOVA model; underlined P -values are significant at α ≤ 0.05.