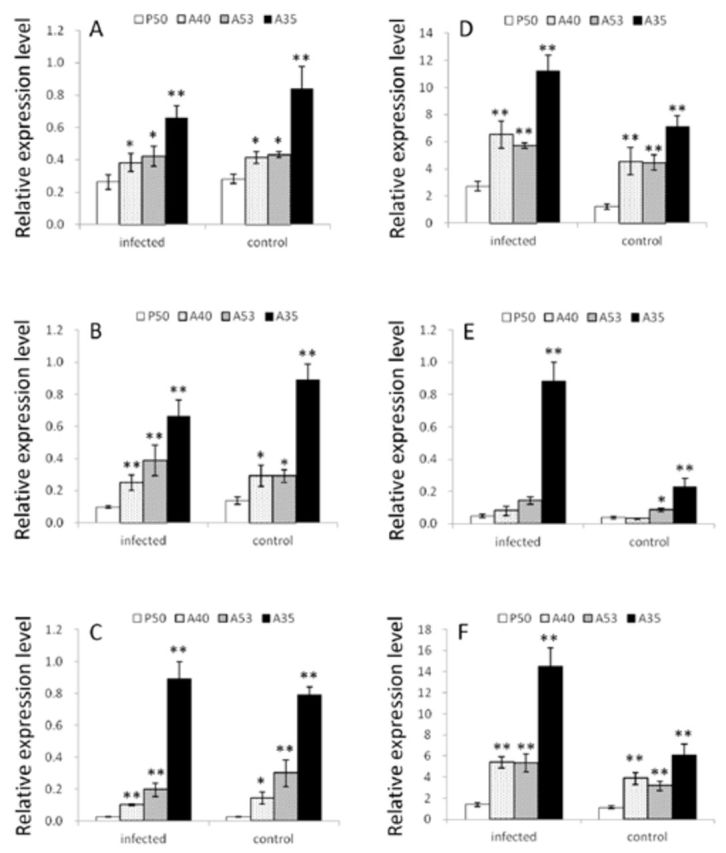
Figure 1.

Relative expression level of antiviral genes in Bombyx mori hemolymph and midgut of different strains. A, B, and C refer to relative expression levels of Bmlipase-1 , BmNox and Bmserine protease-2 in hemolymph, respectively. D, E, and F refer to the same, but in the midgut. The bars from left to right indicate P50, A40, A53, and A35 respectively. *, P < 0.05; **, P < 0.01 (ANOVA and LSD aposteriori test). Error bars ± SEM. High quality figures are available online.
