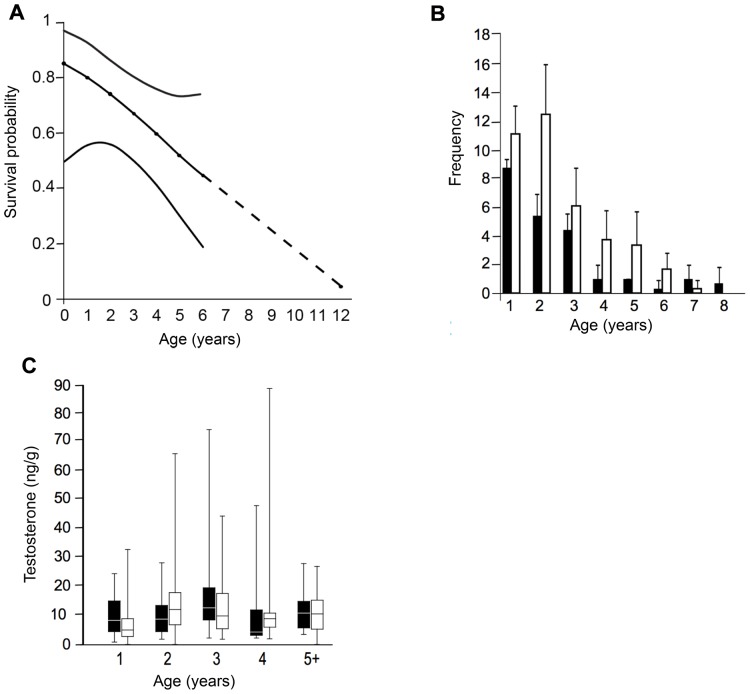
Figure 2. Estimates of survival, frequency of captures, and testosterone levels varying by age.
A: Age dependent survival probability (dashed line) and 95% profile-likelihood confidence intervals. B: The frequency of female (black) and male (white) mouse lemurs included in the study with standard error bars by age. C: Fecal testosterone values for male (black) and female (white) mouse lemurs. Boxes enclose 50% of observations; the median is indicated with a horizontal bar, whiskers denote range.

