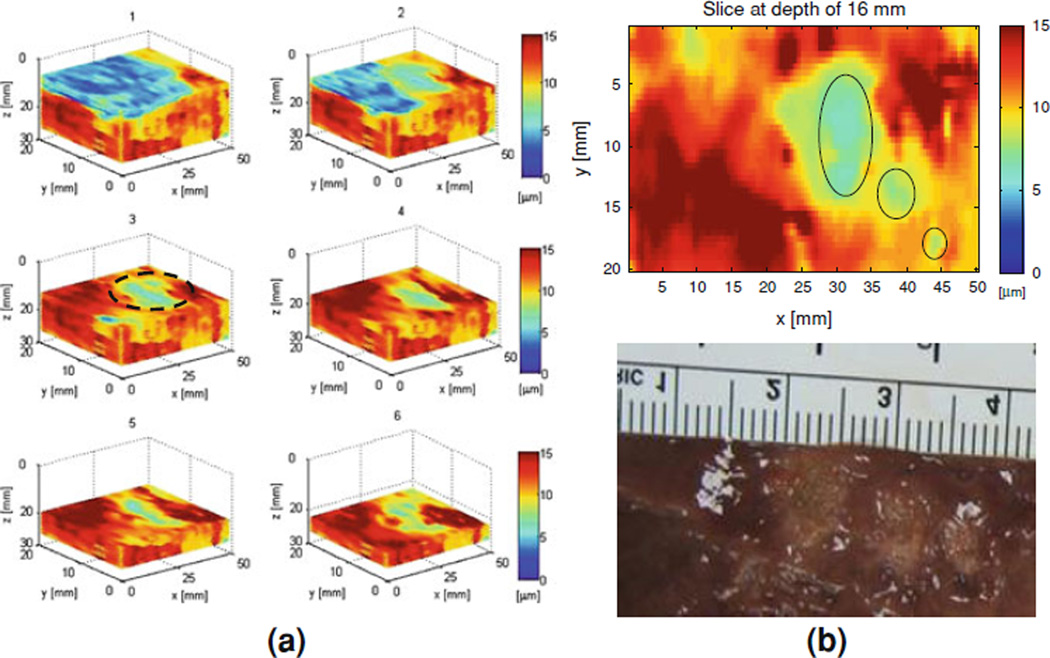
Figure 7.
a 3D HMI imaging (progressive sections at 5 mm steps) of the entire liver specimen ex vivo (in red, highest displacement), HIFU lesions (in green, lower displacement) and saline (in blue, null displacement), the latter used as the coupling medium; b HMI image through the dotted region in a showing three lesions side-by-side with the photograph after liver dissection (lower panel) of the liver showing the three lesions

